TWS Release Notes
Altavista Research-Powered ETF Market Scanners & Columns
Easily find ETFs using the new ETF Market Scanner. Filter and scan 1400 US Equity and Fixed Income ETFs using more than 30 data points provided by AltaVista Research, including Assets Under Management, Expense Ratio, Year-to-date Performance, Developed Market Exposure, Payout, Forward Price/Cash Flow, Long Term Growth, Short Interest and many more. You can also view these data points as columns on any TWS tool, using the ETFs category.
For Equity ETFs, data points also include Book Value per Share, DPS, EPS, Net Margin, Price/Book Value, Price/Cash Flow, Price/Earnings, Price/Growth, Price/Sales, RoE, SPS, Dividend Yield and EPS Growth. Where relevant, data points support data for the previous, current and next fiscal year.
Mosaic Market Scanner: To use in Mosaic Market Scanners, from the Monitor panel click the "add tab" icon at the end of the tab list and select Mosaic Market Scanner. Click Create new custom scan and select ETF EQ (Equity ETFs) or ETF FI (Fixed Income ETFs) from the Universe. In the Fields & Filters section, click Add field and select the ETFs category to apply criteria.

Advanced Market Scanner: To use in the Advanced Market Scanners, from the Mosaic New Window drop down select Advanced Market Scanner. Choose US Equity ETFs or US Fixed Income ETFs as the instrument type then specify Locations, Filters and Parameters.
Columns: Add ETF-based columns to any tool by holding your mouse over an existing field header and selecting Insert Column. From the ETFs category select the column to add.
Recognia Research Technical Indicator Scanners and Columns
New technical market scanners and columns powered by Recognia Research are now available. Recognia’s pattern recognition technology identifies technical events that have formed over days, weeks, and even months which may indicate the trends over the short-, medium- and long-term horizons. Apply technical pattern scanning with other fundamental and technical data points to find the stocks that match your specified criteria. Recognia can recognize over 60 technical events such as Head and Shoulders, Breakouts, Shooting Stars, Hammers, Gravestones, Triangles, Flags, Pennants and more.
Mosaic Market Scanner: To use in the Mosaic Market Scanners, from the Mosaic New Window drop down select Mosaic Market Scanner. Click Create new custom scan and define the Universe. In the Fields & Filters section, click Add field and select the Technical Indicators by Recognia category to apply criteria.
Advanced Market Scanner: To use in the Advanced Market Scanners, from the Mosaic New Window drop down select Advanced Market Scanner. Choose US Stocks as the Instrument, select Locations and Filters, and from the Parameters scroll to select those labeled (Recognia), for example Long Term Event Score (Recognia) or Short Term Trade (Recognia).
Columns: Add Recognia Research-based columns to any tool by holding your mouse over an existing field header and selecting Insert Column. From the Technical Indicators by Recognia category select the column to add.
You must be subscribed to the Research Essentials subscription bundle to access Recognia scans and columns. To subscribe, log into Account Management and from the Manage Account menu select Trade Configuration and then select Research.
Trader's Journal
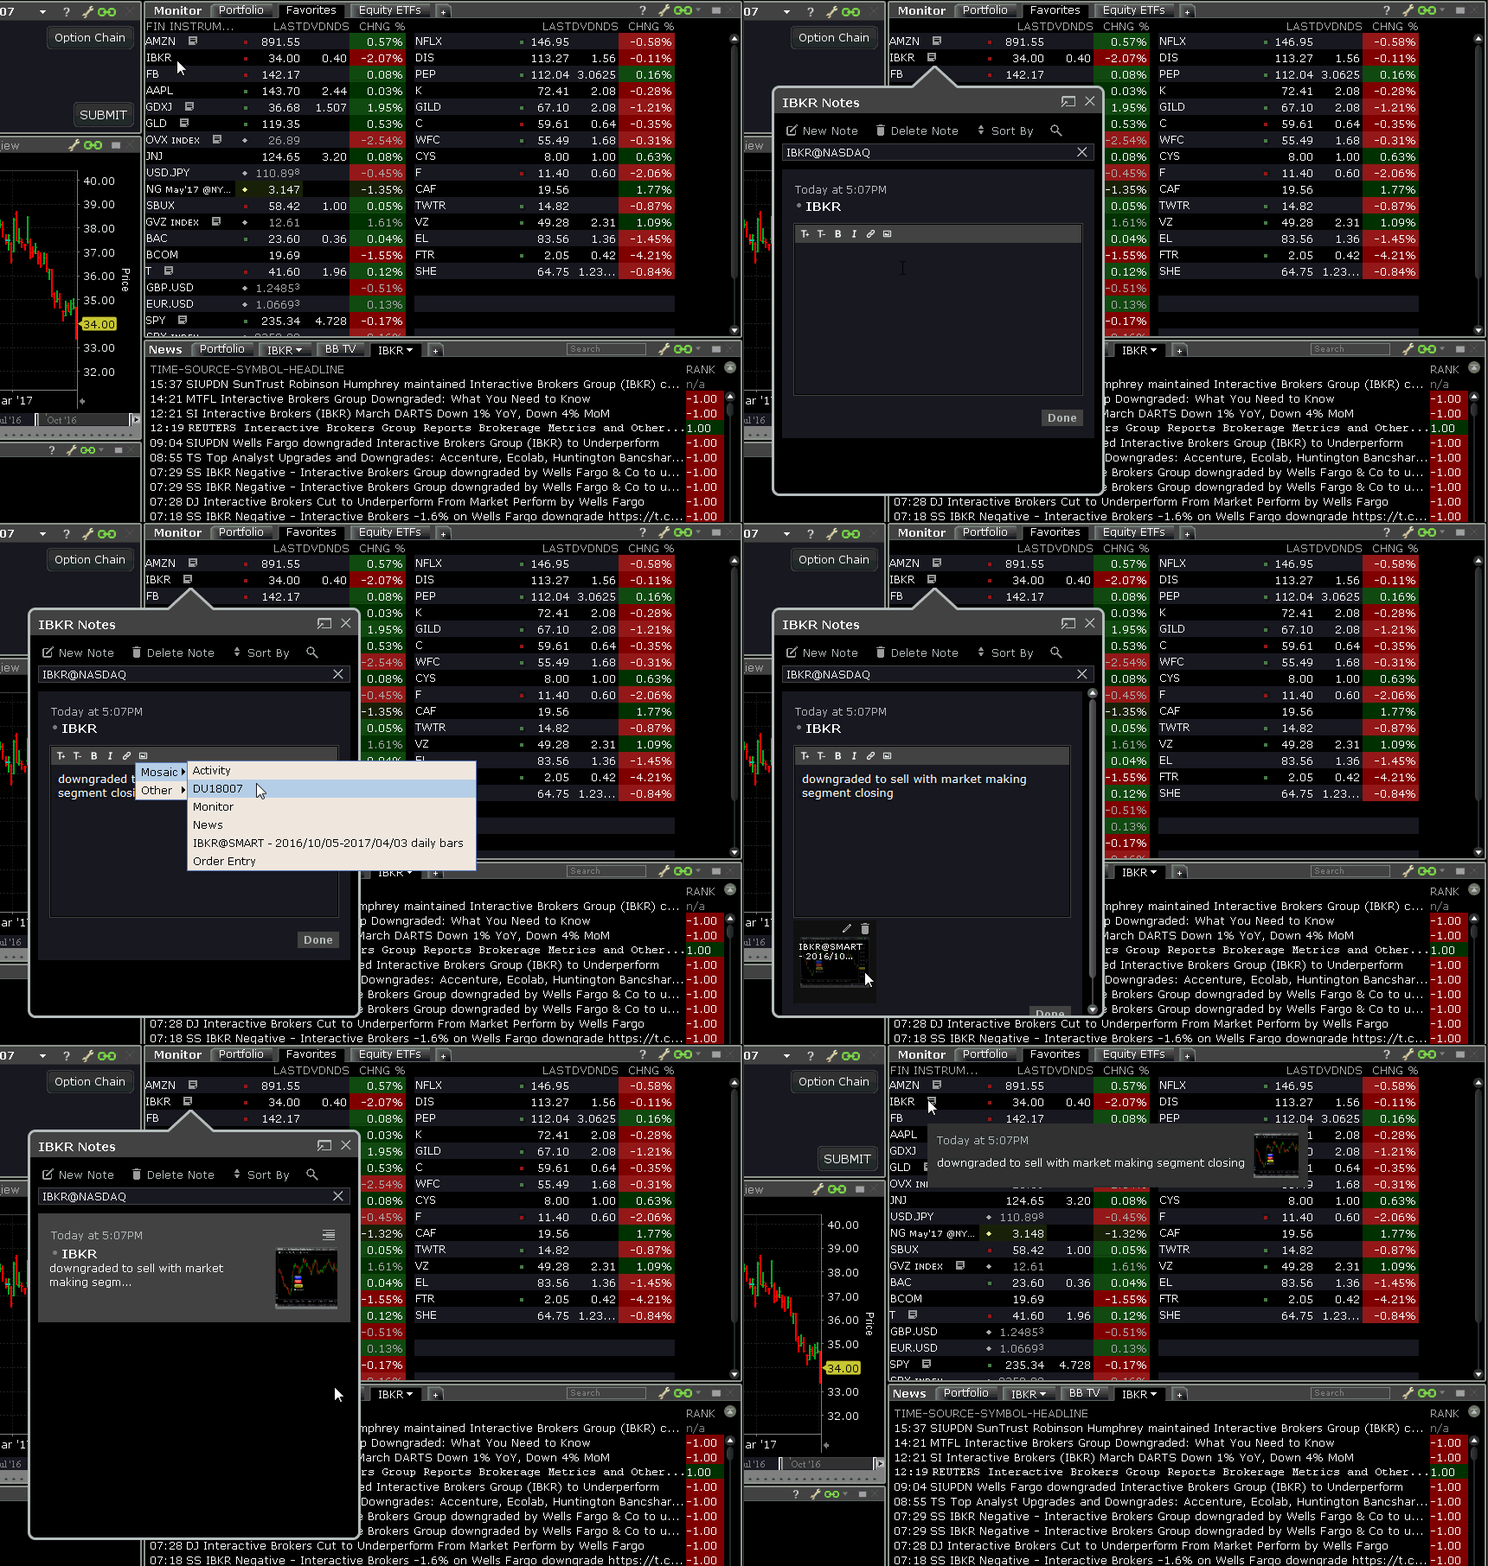
Use our convenient new note-taking feature, Trader's Journal, to record and save your trading ideas for any product in TWS. To open the Trader's Journal, use the New Window drop down and in the Information System section select Trader's Journal. For greatest convenience, use the push pin to make the journal stay on top of other applications, and set it up alongside your TWS layout.
Or, add a note on the fly to any asset by right-clicking the asset and selecting Add New Note. Enter a note in the editor. Add a snapshot of a chart or other tool by clicking the snapshot icon and selecting a tool from the drop down list. Notes are stored by symbol, and any symbol for which you have created a journal entry displays a paper sheet icon. Hold your mouse over an icon to read the note.

Notes are saved and will be available the next time you log into TWS.
Send Us Your Feedback
Tell us how we can serve you better. Beginning with release 964, we've made it easy for you to send suggestions and feature requests to us at IB, all of which will be reviewed by our TWS development team. Simply click the "Feedback" button from the Mosaic anchor window, or select "Provide Feedback" from the TWS help menu to send your feedback.
The feedback feature is for enhancement and feature requests only. For defect requests, please reach out to IB Client Services. Please note that this button is being rolled out gradually. If you have a request but don't yet see this button, please submit your ideas through the Interactive Brokers Features Poll.
Let IBot Add Tickers to your Watchlists
You can now ask IBot to add tickers to your watchlists. Simply select a watchlist from the Monitor panel and enter the command "Add ibkr to watchlist" and IBot adds the ticker to selected watchlist. Or, use the watchlist name, for example "Add ibkr to favorites" and IBot will add the ticker to your "Favorites" watchlist.
To use IBot, from the New Window drop-down in Mosaic select IBot (beta) - type to trade. In the IBot text box type your command. Type "demo" to see a short demonstration. To find out more, visit our IBot feature page.
Trades and Trade Log Windows now Linkable
Both the Mosaic Activity panel Trades window and the Classic Trade Log window can now be linked to other windows as a “Source” using windows color linking. This means that any instrument selected in these windows will be reflected in all other linked tools and windows (Destinations), but their content will not change based on instruments selected in other grouped windows. Hold your mouse over the chain link icon in the top right corner of any linked window to see whether the window is a source, destination, or both.
To link the Trades and Trade Log window to a group, click the colored chain link icon in the top right corner of the window, and from the drop-down list choose the colored group that matches the color of the windows group to which you want to link. Note that in Mosaic, you can link the Trades window to different groups in different layouts, for example you could link the window to Group 1 in the Mosaic layout, and to Group 4 in the Charts – Long Term layout.
More Accurate Delayed/Frozen Combo Data
We are now able to calculate a more accurate quote for multi-leg combinations data that is frozen (after-hours) or delayed.
Enable Mouse-Over Highlighting in Implied Volatility Viewer
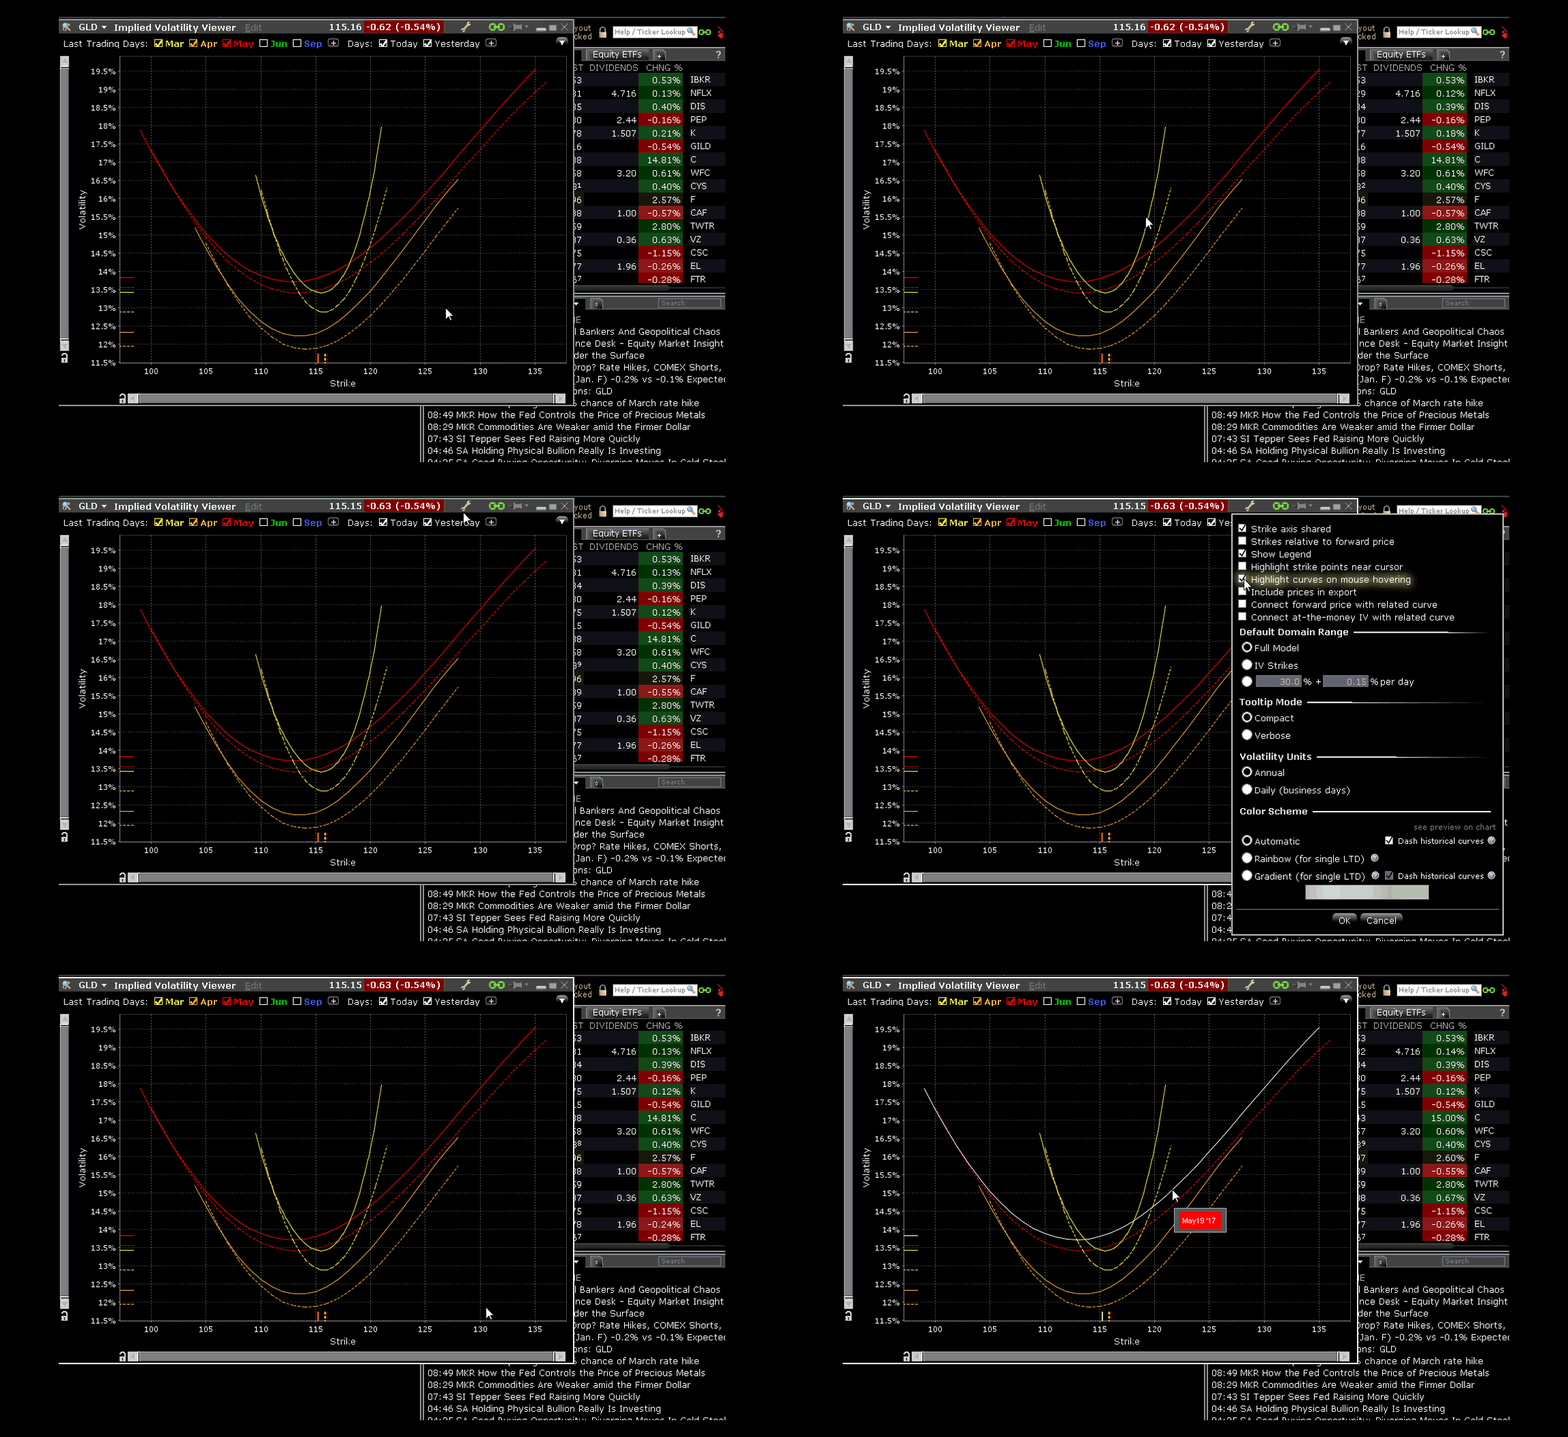
The Implied Volatility Viewer, accessed from the New Window drop down by selecting Option Analysis > Interactive Analytics > Implied Volatility Viewer now lets enable mouse-over highlighting for the volatility curves. This feature highlights the curve that your mouse is over, making it easier to see curves that may use a lighter gradient color.
To enable mouse-over highlighting for volatility curves, click the Configuration wrench icon in the title pane, and check Highlight curves on mouse hovering.

The risk of loss in online trading of stocks, options, futures, currencies, foreign equities, and fixed income can be substantial. Options are not suitable for all investors. For more information, read the "Characteristics and Risks of Standardized Options".
Your capital is at risk and your losses may exceed the value of your original investment.
Interactive Brokers (U.K.) Limited is authorised and regulated by the Financial Conduct Authority. FCA Reference Number 208159.
Cryptoassets are unregulated in the UK. Interactive Brokers (U.K) Limited ("IBUK") is registered with the Financial Conduct Authority as a cryptoassets firm under the Money Laundering, Terrorist Financing and Transfer of Funds (Information on the Payer) Regulations 2017.
Interactive Brokers LLC is regulated by the US SEC and CFTC and is a member of the SIPC (www.sipc.org) compensation scheme;
products are only covered by the UK FSCS in limited circumstances.
Before trading, customers must read the relevant risk disclosure statements on our Warnings and Disclaimers page.
For a list of IBG memberships worldwide, see our exchange listings.